Site analysis
Before you sign the lease, look at the data.
Verno checks every candidate location against the KBV physician directory, local competition, and accessibility. You receive a ranking of your candidates in five business days.
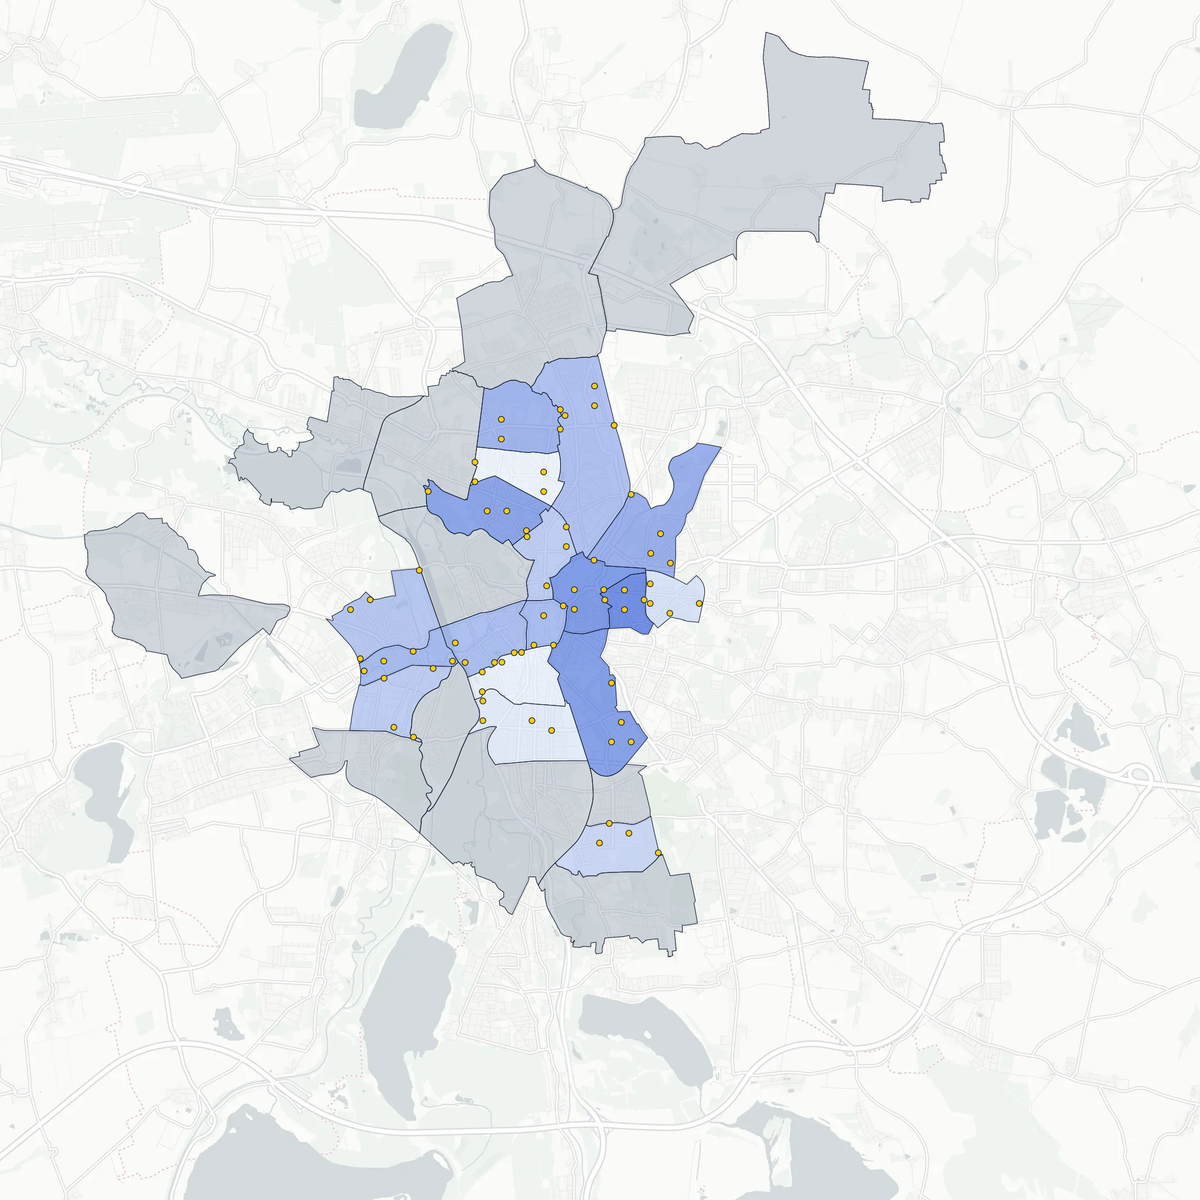
The site decision gets made once. It commits five years of lease and gets decided on a viewing and a broker’s spreadsheet.
Nobody knows which ENT practices are actually in the catchment. Google says 75. Nobody checks the real number.
When the branch underperforms, nobody can separate the wrong location from the wrong execution.
What the usual process cannot see
- 43%
- of a raw Google list of ENT practices was wrong. 75 candidates became 43 verified practices.
- 14%
- of the real referral network was invisible to Google. Six practices no keyword found.
- 0
- of 43 practices had the planned branch as their nearest hearing-aid retailer. A launch means displacement, not capture.
How it works
1
You send us your candidate addresses.
Three to fifteen locations.
2
Verno checks each location in six layers.
Referral practices, competition, catchment, accessibility.
3
You receive a ranking with a recommendation.
Five business days, by email.
Step 1
Understand the business
What drives demand in your industry?
Step 2
Map the whole city
Real OSM boundary, every relevant location.
Step 3
KBV cross-reference
Every ENT practice verified against arztsuche.116117.de.
Step 4
Score the candidates
Distance, demand, verification. One score.
Step 5
Recommend streets
Specific streets, not vague districts.
The five steps stay the same. Step 3 and the data sources adapt to your industry.
What you receive
- Interactive map with a score per district
- Priority list with rationale and a starting coordinate
- One-page explanation of the methodology
- Raw data with a source citation per entry
- Every delivered dataset ships with a manifest recording source, timestamp, and checksum.
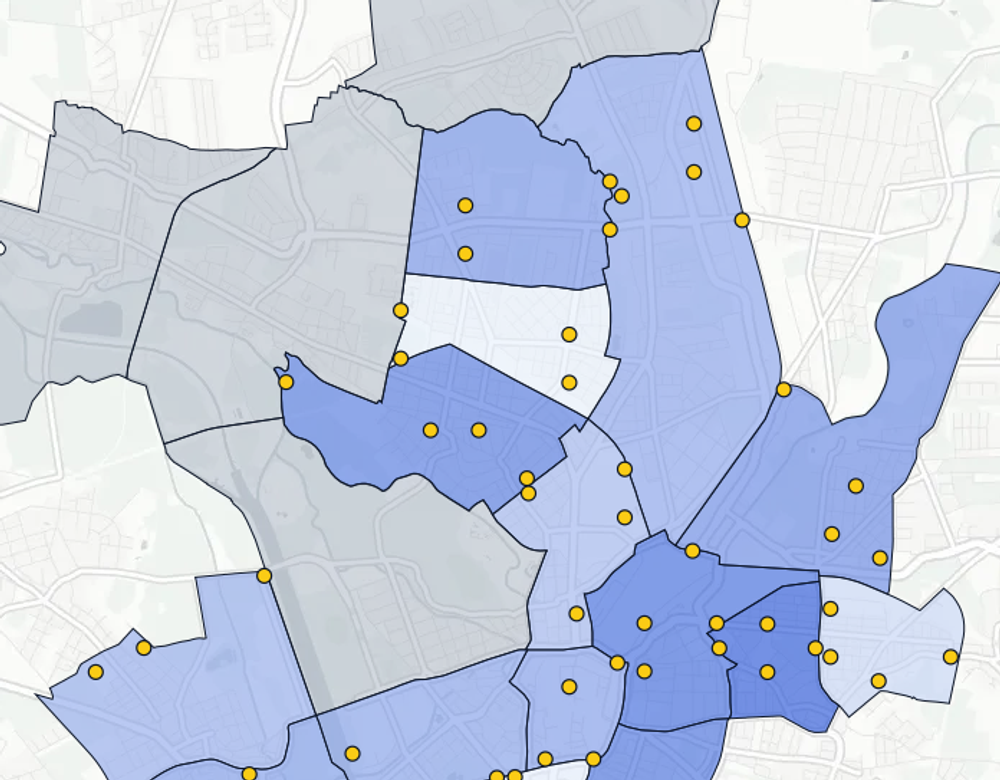
Excerpt from the priority list
District 01
Priority 1 · Structural gap score 1.00
0 ENT practices, nearest competitor 0.7 km, 47 demand POIs nearby.
Operator note: scout the drill-in candidate scoring 1.00 first.
District 02
Priority 2 · Structural gap score 0.89
2 ENT practices, nearest competitor 0.8 km, 89 demand POIs nearby.
Operator note: dense surroundings, but two competitors already present.
Two entries from a real priority list. Anonymised, unchanged in structure.
Of 43 verified ENT practices in the catchment, zero had the planned branch as their nearest hearing-aid retailer. That finding changed the launch playbook.
Price and next step
From 1,500 EUR per metropolitan area.
Multi-city engagements and framework agreements on request. Stripe invoice, no subscription.
Request an analysis
Step 1 of 4
How Verno handles your details is described in the privacy policy.
Free quick analysis
Enter a city and industry. We deliver an initial assessment in two minutes.
Query location data yourself
Self-serve location data for your team. Query cities and categories yourself, results as CSV. We will notify you at launch.
How Verno handles your details is described in the privacy policy.